Posts Tagged graph
How to Create an Animated JavaFX’s Line Chart ?
Posted by Sébastien Stormacq in Java on 19/07/2010
Java FX introduced charting components back in 1.2 version : AreaChart, BubbleChart, PieChart, LineChart … you name it.
You will find a good introduction to LineChart capabilities in Rakesh’s blog entry.
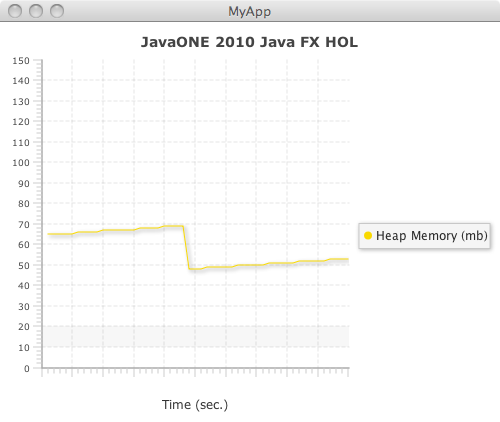
One common request found in forums and blogs over the Internet is to create an animated LineChart, i.e. a line based chart where the line is moving from left to right as values are added to the component.
JavaFX.com official website even host an ugly attempt to implement this : by moving a Rectangle over the scene, gradually showing the chart below it. (nope, this is not a joke, go and read it by yourself)
While preparing sessions and labs for the upcoming JavaONE 2010 conference, my colleague David and myself did implement a true Animated LineChart component.
This component exposes a very simple public API :
public function addValue(v:Integer) {}
Each time a value is added to the graph, the line will move to the right side, possibly discarding older values on the left side when the line will reach the graph’s right border.
The magic is done as following : new values are added to the LineChart.Series[0].data[] array. When the array is filled in (when the number of elements in the array is equal to the number of tick marks available on the X axis), the oldest value (LineChart.Series[0].data[0]) is removed and all values are shifted one position left in the array.
Source code and detailed instructions to build this AnimatedLineChart component will be given during our JavaONE 2010 Hands-On Lab (S616734 currently scheduled for Thursday, 23rd at 12:30 pm at the Hilton) (see UPDATE at the end of this post)
In the meantime, you can have a look at the screenshot below.
[UPDATE : November 2011]
Due to popular demand, and because we learned that Oracle will not make JavaOne’s talk freely available to all, like Sun use in the past, here is the source code for this component. Enjoy !
